

I began this research with what seemed like an easy question: which new AI model is best? Then I found the same model with three different scores on the same benchmark.
On AutomationBench, OpenAI’s GPT-6 Astra launch page lists GPT-5.6 Sol at 18.1%. Anthropic’s Claude Fable 5.1 page lists it at 19.6%. Zapier’s own live leaderboard shows 28.77% at max effort.
That is too large a gap to hide behind rounding. But it is not automatically evidence that somebody made a mistake. The scores can come from different task sets, effort levels, harnesses, and dates.
This changed the question I wanted to answer. Instead of asking which model won, I asked: what exactly produced the number?
My small research method
I copied the benchmarks from the latest flagship pages I could find for OpenAI, Anthropic, Google DeepMind, and Moonshot AI. Then I opened the benchmark creators’ pages and looked for the boring details: the version, task count, allowed tools, agent harness, reasoning setting, trials, and grader.
The overlap was smaller than I expected. Even when two labs used the same benchmark family, they did not always use the same release.
| Instrument | OpenAI | Anthropic | Moonshot | |
|---|---|---|---|---|
| OSWorld 2.0 | yes | yes | yes | yes |
| Humanity’s Last Exam | yes | yes | verified set | yes |
| Terminal-Bench | 4.0 | 4.0 | 4.0 | 2.1 |
| DeepSWE v1.1 | yes | system card | yes | yes |
| AutomationBench | yes | yes | — | public set |
| GDPval-AA v2 | — | yes | yes | yes |
| ARC-AGI-3 | yes | not available | — | — |
Coverage on the labs’ launch pages and linked model/system cards, read on 4 September 2026. “Yes” does not mean the protocol was identical.
The practical lesson is simple: a score is a reading from an instrument. It is not an IQ score printed directly by a model.
Observed score ≈ model capability × harness quality × tool access × compute budget × benchmark design × scoring method
This is a metaphor, not a mathematical law. Its job is to stop us from mentally deleting the rest of the evaluation setup.
Case one: 62.7% and 99.9% can both be real
ARC-AGI-3 tests an agent on unfamiliar interactive environments. The agent has to explore, infer hidden rules, remember what it learned, and act efficiently. It is closer to learning a tiny unknown game than answering a quiz question.
ARC Prize publishes two harness conditions for GPT-6 Astra. Its verified results page reports a best score of 62.71% with the Standard harness at max reasoning. With OpenAI’s Provider Adapter harness, it reports 99.95% at high reasoning.
The Standard harness keeps a provider-neutral text history and lets the model carry forward visible notes. The Provider Adapter can preserve opaque reasoning state between requests and compact longer conversations. Same model family. Same benchmark. Different way of keeping the agent oriented.
That does not make the higher score fake. It makes it a score for Astra plus that adapter. If I want to compare two base models, I should hold the harness constant. If I want to know what the best deployed system can do, the adapted result may be the more relevant one. Those are different questions.
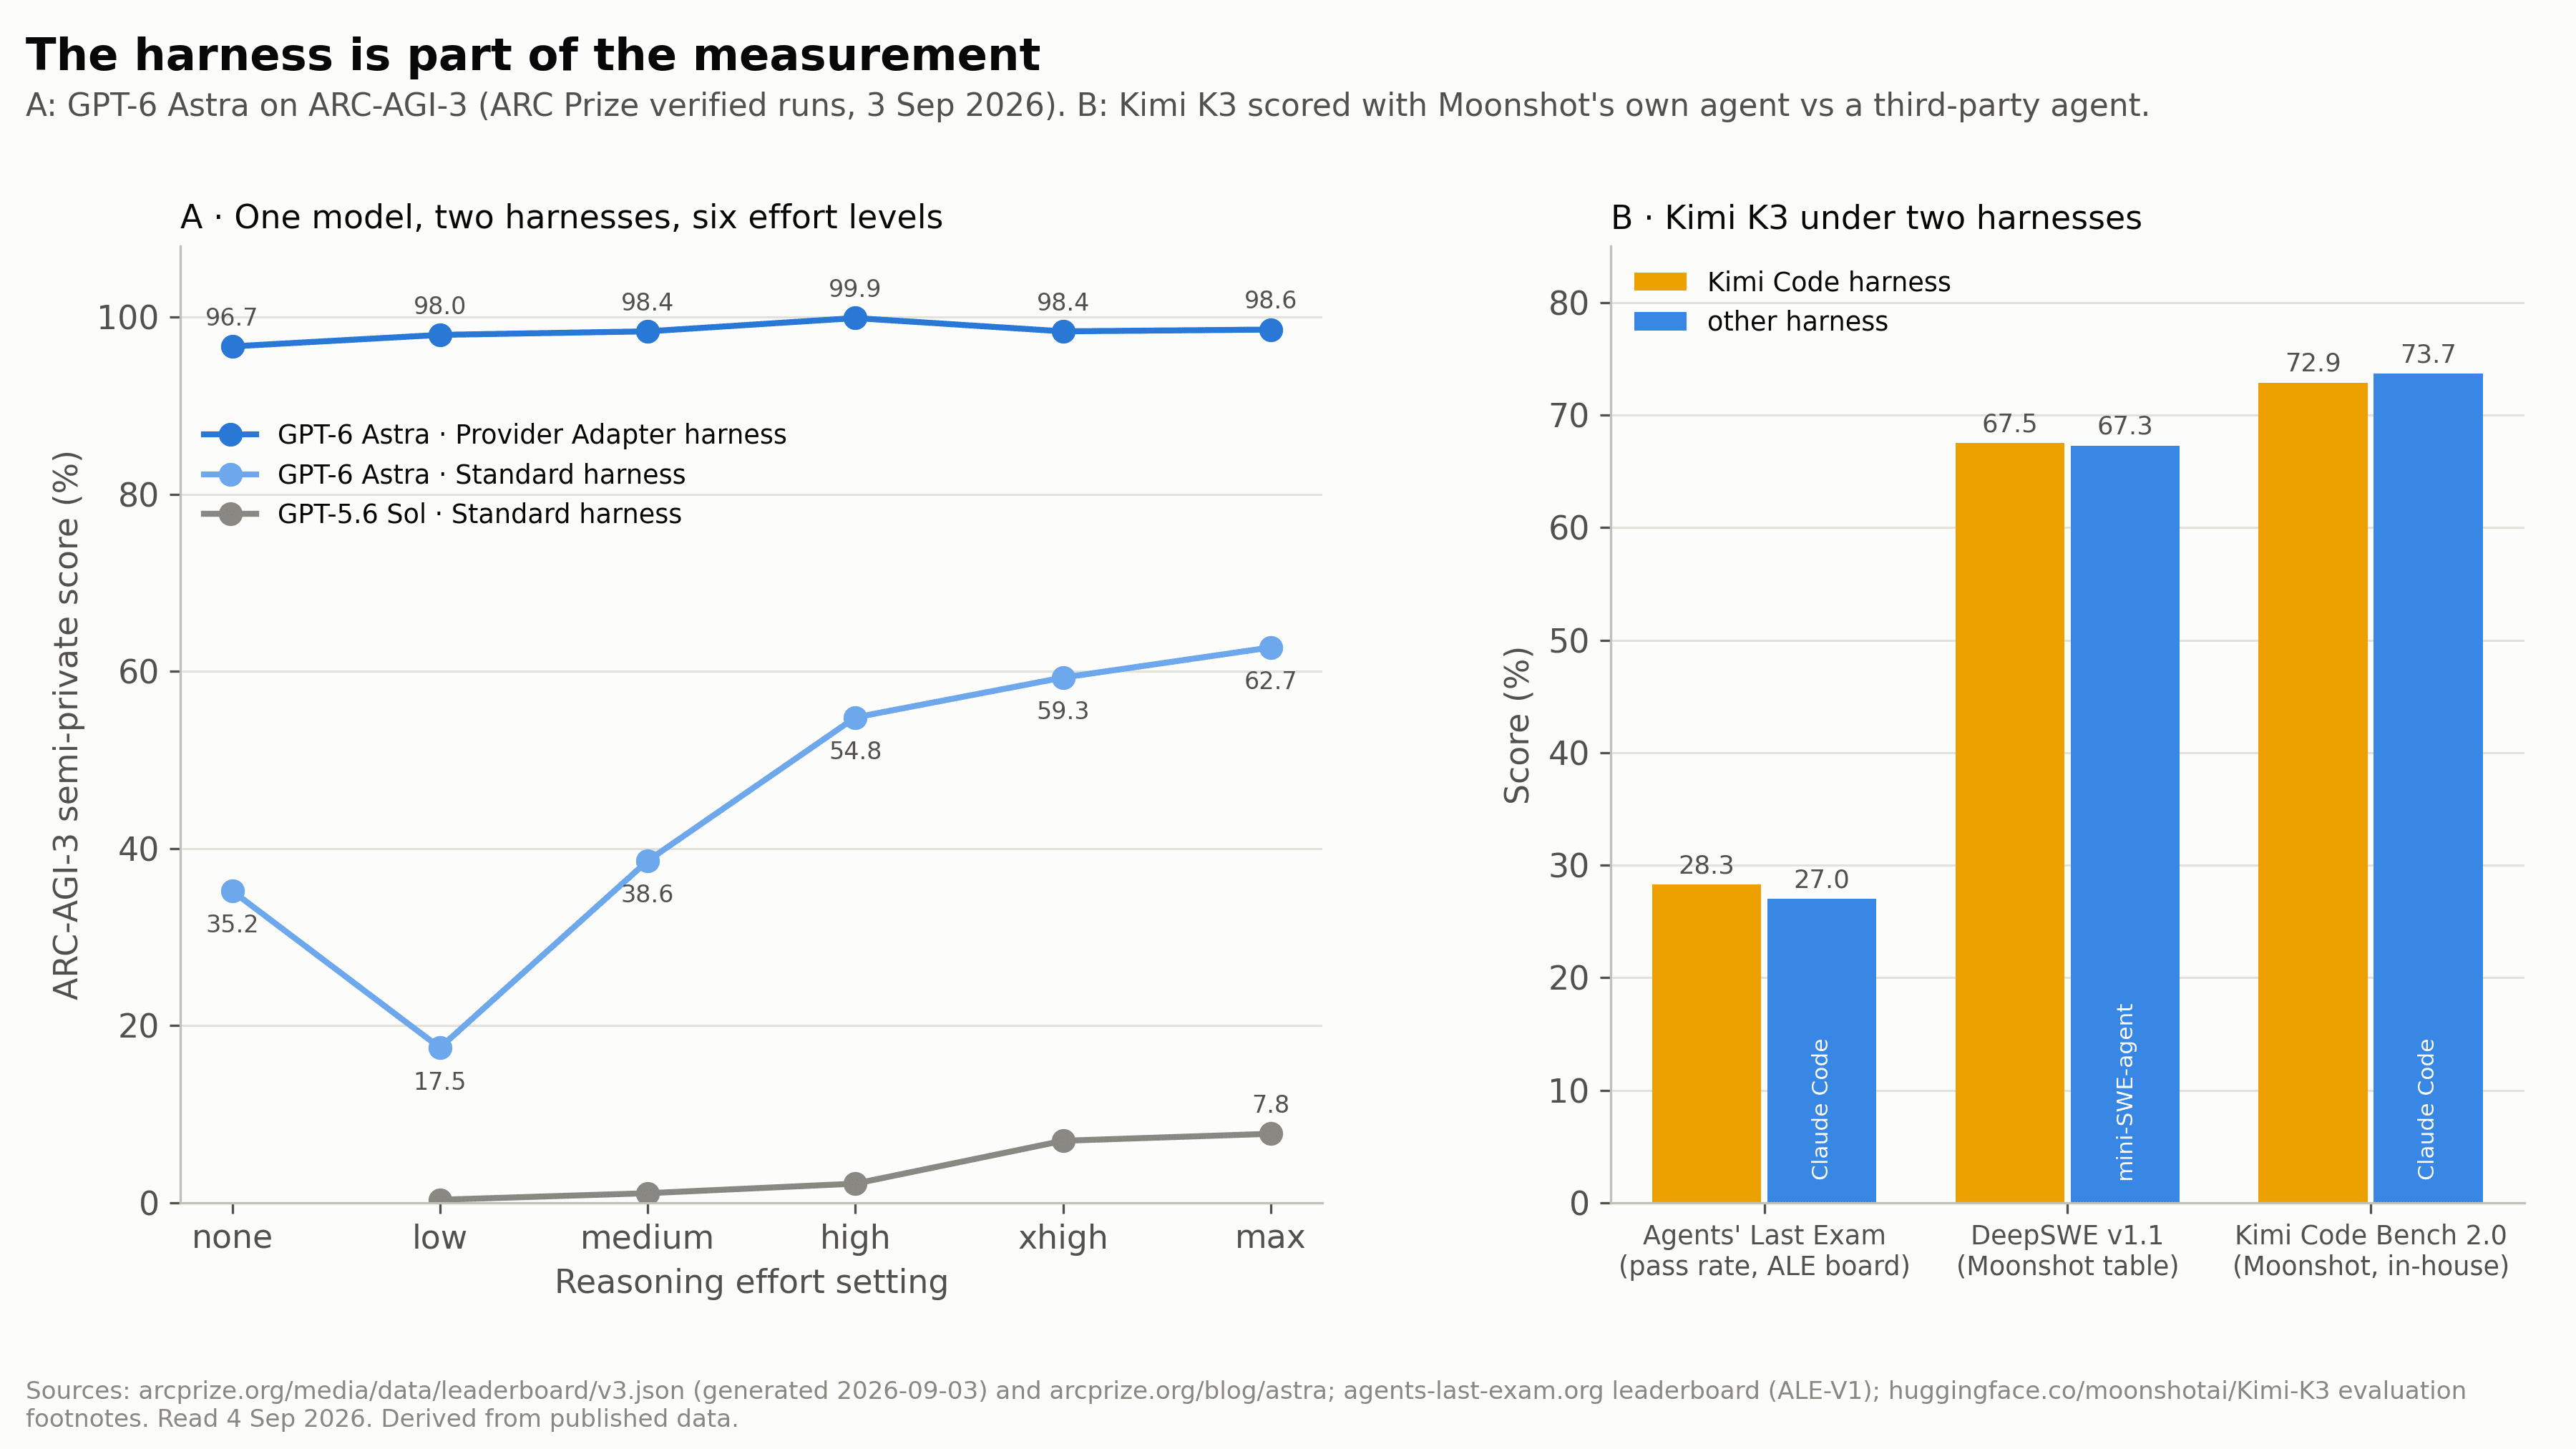
The harness is part of the measurement. Derived from ARC Prize’s verified runs and Moonshot’s published evaluation notes; sources are printed in the figure.
Case two: the public set is not the private set
AutomationBench puts an agent inside a simulated company. It can use 47 tools across sales, marketing, operations, support, finance, and HR. A task might require reading an email, finding the correct customer record, updating a deal, and notifying the right person. Hidden assertions inspect the final state.
Zapier releases a 600-task public set for development. Its headline leaderboard uses a separate, deliberately harder private set. Moonshot explicitly says it used the public subset. That already prevents a clean comparison with a private-board score, even though both rows say “AutomationBench.”
Effort adds another layer. Zapier’s current board lists several Sol entries: 28.77% at max, 26.33% at xhigh, and 24.81% at high. A model name without its effort setting is incomplete metadata.
There is also a systems wrinkle. The board’s leading Fable 5.1 result uses an Opus 5 fallback when safeguards interrupt a task. That score answers a useful product question—can this deployed system finish the workflow?—but not the narrower question of what Fable 5.1 alone can finish.
Case three: benchmark versions are different exams
Terminal-Bench gives an agent terminal-based tasks in isolated environments and checks the result with hidden tests. Version 4.0 contains 66 tasks after the maintainers removed or repaired earlier tasks and changed the infrastructure. A task passes or fails; the headline number is the resolution rate.
OpenAI and Anthropic reported Terminal-Bench 4.0. Moonshot’s Kimi K3 card reported Terminal-Bench 2.1. Those scores belong in different columns, not in a horse race.
The smaller discrepancies are also educational. The public board placed Astra around 58.2% with a ±2.8-point interval, while OpenAI reported 57.9%. That is not a meaningful disagreement. The interval is doing exactly what readers need: showing how noisy a finite set of tasks can be.
Case four: 95% can mean very different things
GPQA Diamond is a 198-question, graduate-level multiple-choice set in biology, chemistry, and physics. OpenAI reports Astra at 96.0%. That is impressive, but it should not be compared numerically with 96% on a computer-use benchmark.
GPQA mainly asks whether a model selects the correct answer to a static question. An agentic benchmark may require dozens of correct actions, state tracking, tool use, and a valid final environment. If every step must work, small errors compound.
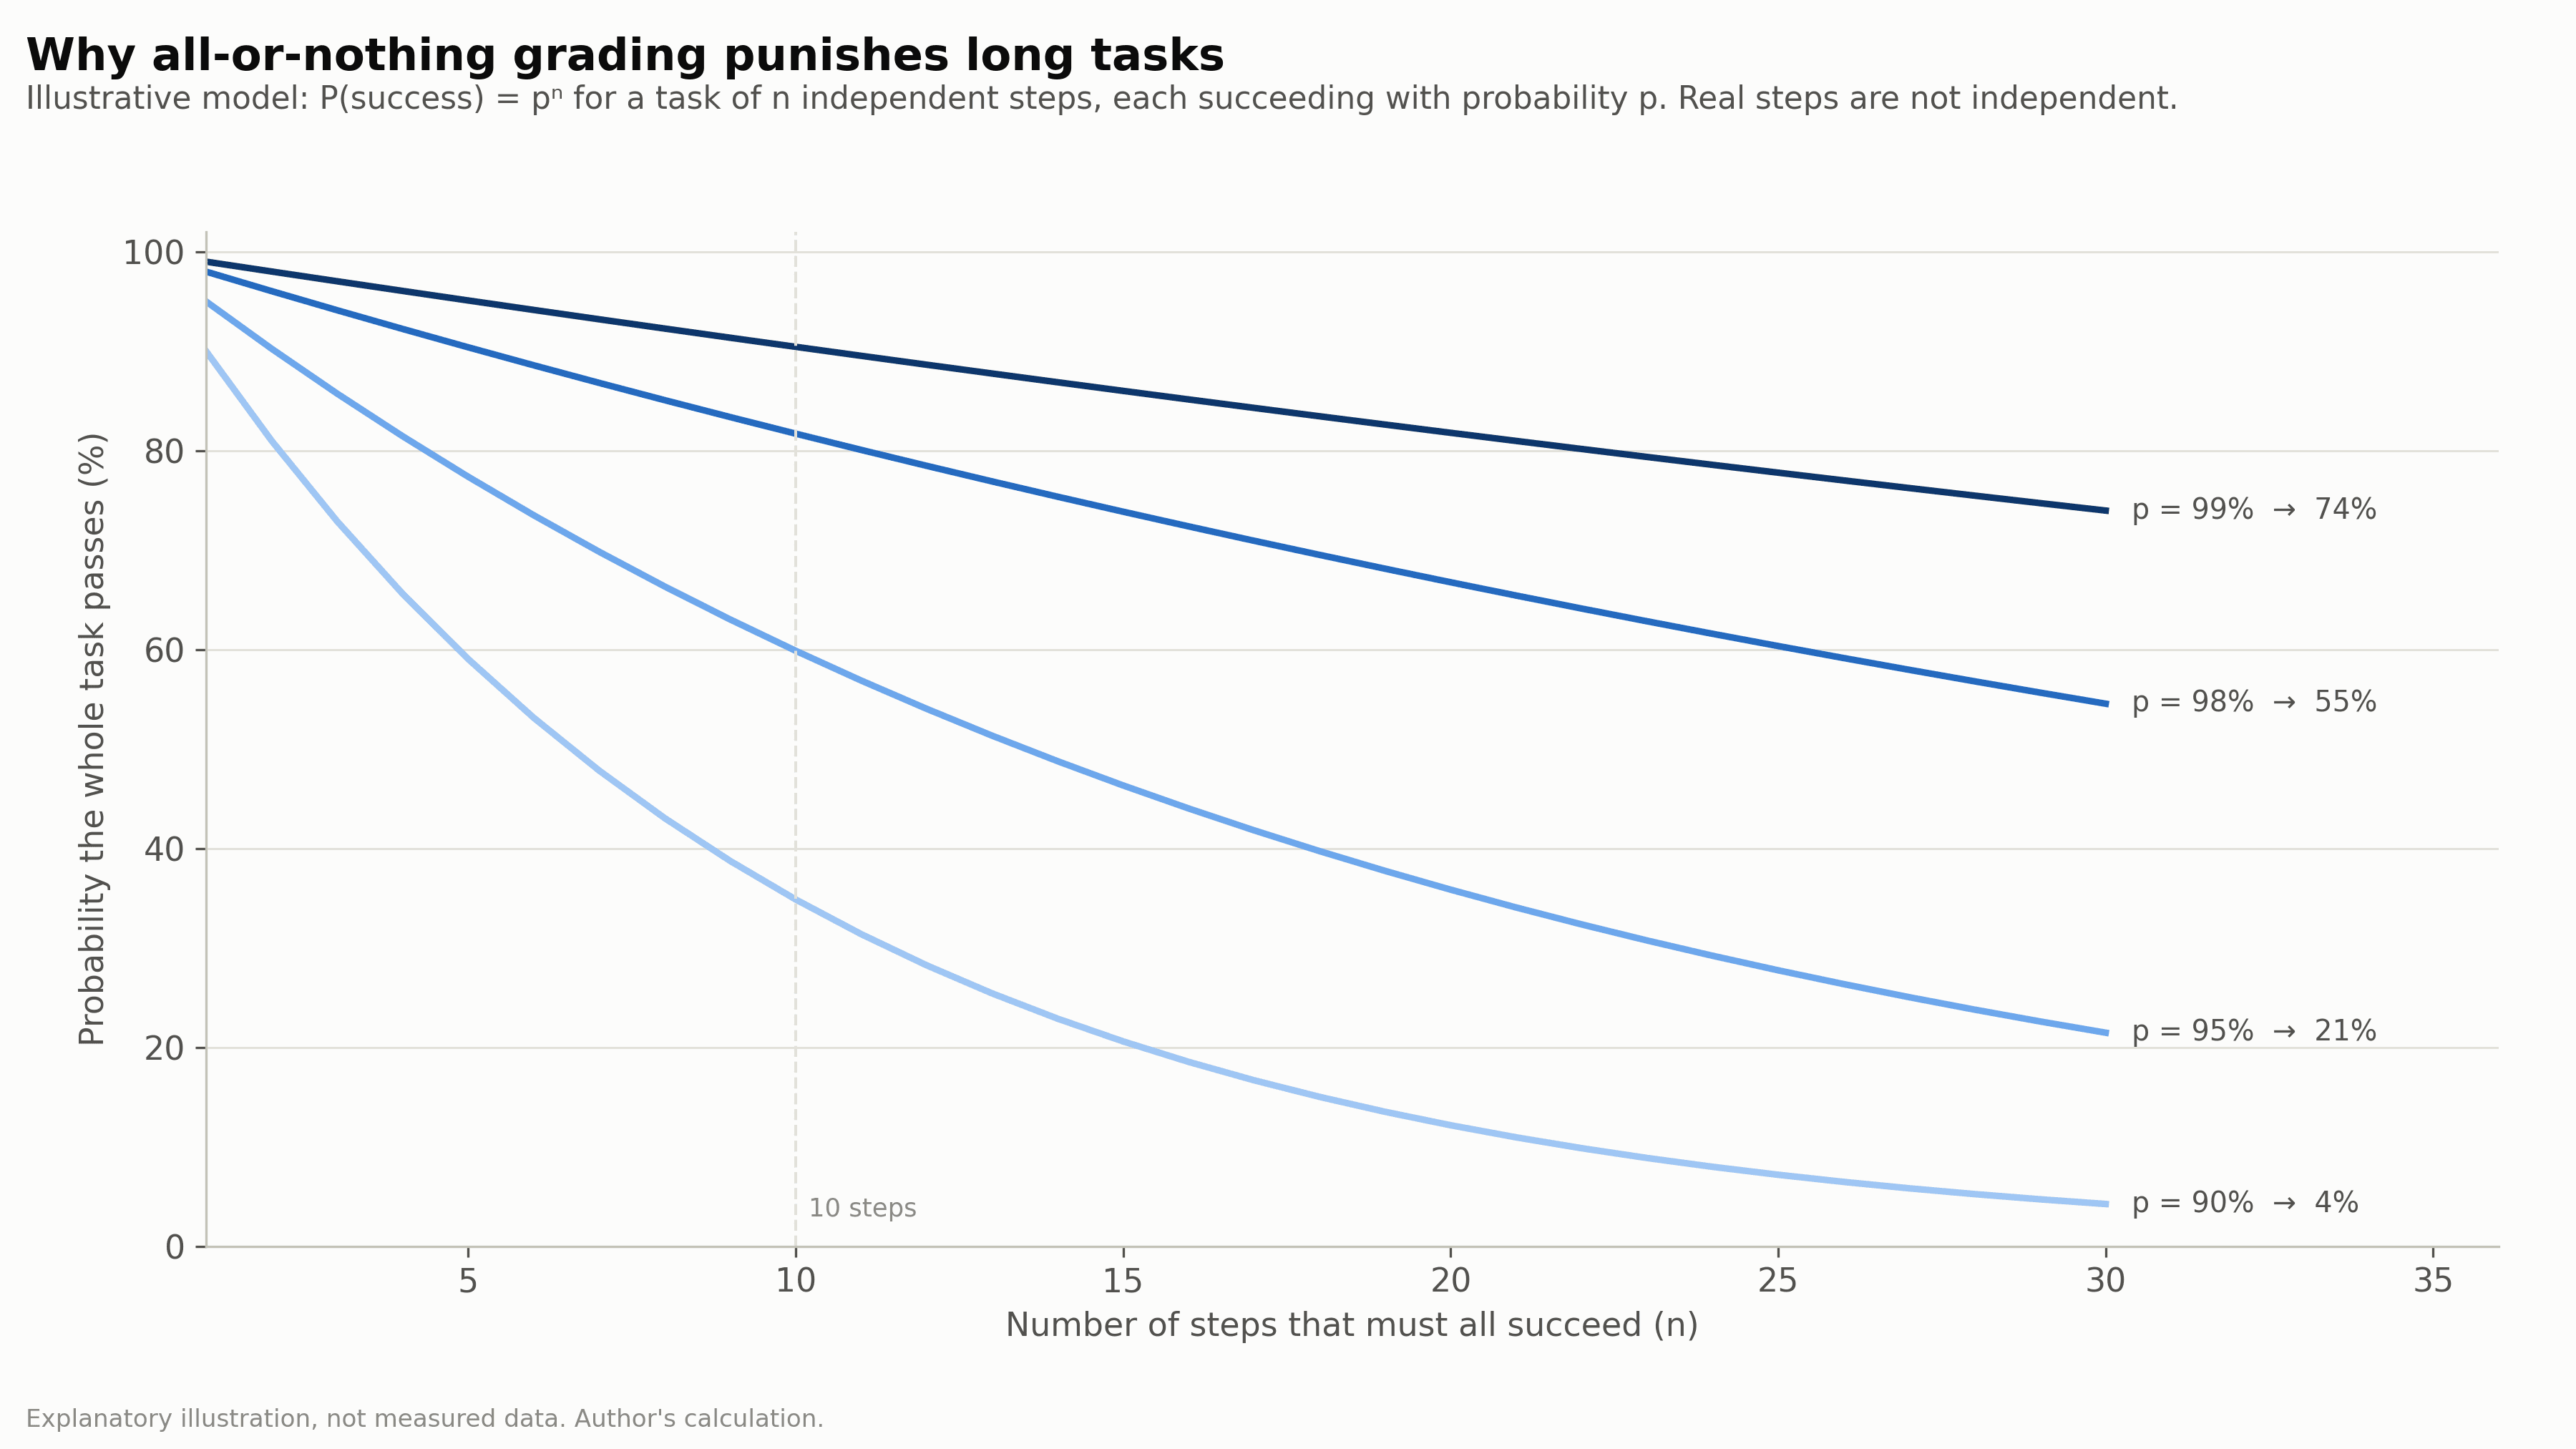
An illustration, not benchmark data. If each independent step succeeds with probability p, an n-step task succeeds with probability pⁿ. Real steps are not independent.
This is why identical percentages on different benchmarks are not interchangeable units. “90%” only has meaning after we know 90% of what.
The six questions I now ask
When I see a benchmark table, I no longer begin with the bold number. I ask:
- Which exact version and task subset was used? Terminal-Bench 2.1 and 4.0 are different instruments.
- Was the score produced by the model or a model-plus-harness system? ARC-AGI-3 makes the difference visible.
- Which tools were available? Web search, Python, a terminal, and computer control can change the task.
- What was the effort or compute budget? “Max” and “high” are not labels to throw away.
- How many runs were averaged, and where is the uncertainty? A two-point lead can fit inside the error bar.
- Who ran it, and how was it graded? A lab’s internal run, a public leaderboard, and an LLM judge answer different questions.
No single benchmark can collapse coding, science knowledge, browser use, business workflows, and abstract reasoning into one honest “intelligence” number. A useful evaluation portfolio looks more like a dashboard than a podium.
What I would put in the headline instead
After tracing these numbers, I do not think the right conclusion is that benchmark tables are useless. They are useful when the protocol travels with the score.
A responsible comparison might read: Model X, with harness Y, at high effort, solved 58% of version 4.0’s 66 tasks over five runs. It is less exciting than “58% intelligence.” It is also something another researcher can understand, challenge, and try to reproduce.
That is the standard I will use next time a model launch fills my feed with green bars. First read the axis. Then the footnote. Only then the number.
Sources and further reading
- OpenAI — GPT-6 Astra launch and evaluation notes
- Anthropic — Claude Fable 5.1 and Mythos 5.1
- Google DeepMind — Gemini 3.8 Flash model card
- Moonshot AI — Kimi K3 technical blog
- ARC Prize — GPT-6 Astra verified results
- Zapier — AutomationBench leaderboard
- Terminal-Bench — official leaderboard
- GPQA paper
Research checked against live pages on 4 September 2026.